Google have finally released a new Froogle Performance Tool which shows a host of useful data about your Froogle impressions, clicks and feed items. You can find it by logging into your Google Base account and clicking on the new Performance section.

Google Product Search, or Froogle as it’s far better known, is a price comparison site with a big difference – it’s completely free. This makes is an attractive channel to reach your customers; all you need is a product feed.
Like so many other digital marketers, I’ve been waiting on this tool to optimise Google Product Search for ages – I’d even gone as far as to previously develop a dirty Excel hack that queried Froogle data. The new froogle performance tool now provides all this data in a choice of slick graphs or CSV downloads.
Filters
Item Type
Allows you to select the Google Base feed to analyse.
Froogle is just one part of Google Base (which also contains books, scholar, recipes, vehicles etc.) If you’ve only got a Froogle feed then this isn’t an selectable option, otherwise you’ll need to choose Products to view Froogle data.
Target Country
If you are submitting items to multiple countries, you have the option to filter by country.
Destination
Allows you to select between Click data and Impression data
Items Graph
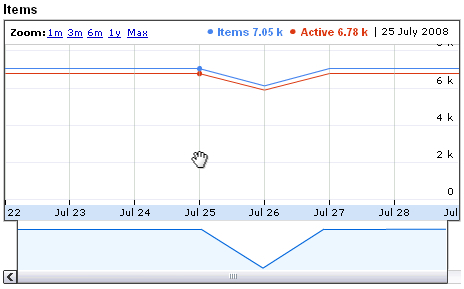
This is a great way to see how many of your feed items are inactive compared to your total feed. Most large Google product feeds will have a few inactive items due to various reasons. We’ll definitely write a post some time about how to minimise this and ensure your feed is firing on all cyclinders.
The blue line shows your total amount of items in your feed, and the red line shows your active items. As you reduce errors on your feed items you’ll see the lines get closer together.

Performance Graph
Anyone familiar with Google Analytics will feel right at home with these graphs. You can set the date range with either the Zoom function or the familiar Google Analytics date sliders under the graphs. You can also hover your mouse over the graph to get specific values for a given day.
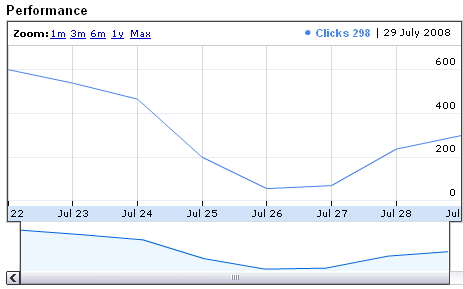
Froogle Clicks (set the Destination drop-down menu to Search)
The graph shows you how many people clicked on your products along a timeline.
Sharp dips are a good indication of broken feeds or competitor activity.
Gradual dips and rises are a good indication of seasonal demand or price competitiveness
Sharp rises are a good indication you are doing something right, or your competition have dropped out.

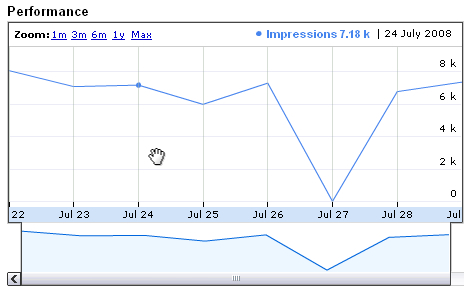
Froogle Impressions (set the Destination drop-down menu to API)
This graph is as close to genuine ad impressions as you can get. It’s actually how many times the Google API returned an item from your Froogle feed. This means the API impressions will probably include all automated queries run by scrapers and bots.
For Google, publically releasing specific values of this kind of data is almost unheard of. However let’s not look a $25 billion gift horse in the mouth – we can use this impression and click data to really optimise our Froogle feed, and monitor the changes both on-site (via web analytics) and now off-site (via the Froogle Performance Dashboard).

Performance Details Download
If you’re a data-head like me, you can download a CSV of all your performance data and load it into Excel (or your favourite spreadsheet program) for even more fun.
A quick warning about the Froogle CSV data download however…
View details about your content and its performance as an average of the last 7 days. Select an item type or data feed to download a report containing the daily metrics for the 1,000 most-clicked items.
You can choose to download by data feed or by Google Base product type (you’ll want Products for Froogle). When you view the report in Excel you’ll notice alternating columns for clicks and API impressions – it’s a little difficult to read at first until you get used to it.
The reports are a little buggy at the moment (sometimes showing clicks but zero impressions) and I’ve emailed Google hoping to get some feedback on this issue which I’ll post later – remember that it’s a new release and the Google Base team will be treating it as a beta release in true Google style.
How can this optimise your Froogle feed?
Here’s just a few ways to improve your product feed with the new Froogle Performance Dashboard:
Use the Items Graph to monitor and reduce wasted feed items.
Regularly eyeball the Froogle clicks on the Performance Graph to spot indications of competitor activity and price sensitivity issues.
Start collecting Froogle click data now so that next year you have historical seasonal performance.
Keep informed of your Froogle impressions to optimise your feed titles and descriptions for better visibility.
I love Froogle. Optimising natural search campaigns is my bread and butter, however there’s always the occupational frustration that SEO usually doesn’t produce instant results. Every marketer enjoys seeing immediate growth and revenue from their work – both for their clients and for themselves – and Froogle is a great platform to get some quick wins for everyone.
6 comments ↓
[…] can find it by logging into your Google Base account and clicking on the new Performance section.Introducing the New Froogle Performance Dashboard | The Matchbox Facebook Dashboard […]
[…] Introducing the New Froogle Performance Dashboard, The Matchbox […]
[…] Introducing the New Froogle Performance Dashboard – Google have finally released a new Froogle Performance Tool which shows a host of useful data about your Froogle impressions, clicks and feed items. […]
Excellent post.
[…] Lindop gives a good rundown of the Froogle Performance dashboard. I heard that Froogle comes with a free frogurt…unfortunately, the frogurt is also […]
[…] Lindop gives a good rundown of the Froogle Performance dashboard. I heard that Froogle comes with a free frogurt…unfortunately, the frogurt is also […]
Leave a Comment